
Crypto trader Merlijn The Trader believes Ethereum is approaching a move that could catch much of the market off guard. His analysis focuses on the long-term ETH/BTC ratio, comparing the current structure with past cycles that preceded explosive Ethereum outperformance.
According to Merlijn, the setup today closely mirrors previous periods where Ethereum spent years consolidating against Bitcoin before entering sharp upside phases. While the macro backdrop is different, marked by deeper liquidity and stronger institutional involvement, the structural pattern appears strikingly similar.
What the Chart Is Showing
The chart spans two major historical phases: 2015–2018 and 2018–2025.
In both cases, Ethereum first entered a prolonged accumulation phase, where the ETH/BTC ratio moved sideways after heavy declines. This was followed by a re-accumulation range, marked by lower highs and compressed volatility inside descending channels.
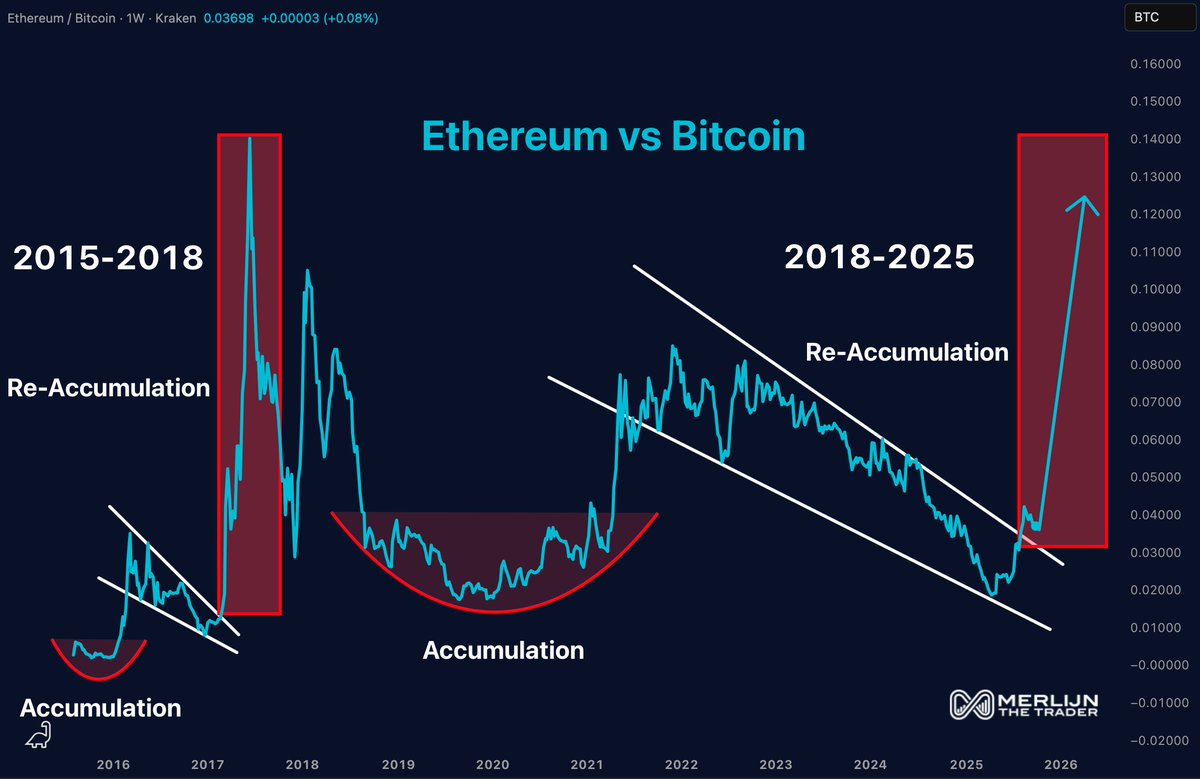
In the earlier cycle, once Ethereum broke out of this re-accumulation structure, the ETH/BTC ratio surged vertically, highlighted by the red box on the left side of the chart. Merlijn argues the current structure on the right side shows the same conditions forming again.
The key takeaway: Ethereum appears to be exiting a multi-year downtrend against Bitcoin and positioning for a potential expansion phase.
Key Levels That Matter
Merlijn outlines two critical scenarios:
- Bullish scenario:
A sustained breakout in ETH/BTC confirms the re-accumulation thesis. In this case, Ethereum could significantly outperform Bitcoin, similar to prior cycle expansions. - Bearish contingency:
If Ethereum fails to hold its current structure and rolls over, the breakout thesis is delayed, but not invalidated. Accumulation would simply extend further.
While the ETH/BTC ratio is the core focus of the chart, Merlijn also references $3,600 as an important psychological level for Ethereum in USD terms. A clean break above that level would likely coincide with strength against Bitcoin. Conversely, a deeper pullback toward $1,800 would be viewed as a high-conviction accumulation zone rather than a structural failure.
Why This Cycle Is Different
Merlijn emphasizes that while the chart structure looks familiar, the environment has changed:
- Larger market capitalization
- Increased institutional participation
- More liquidity across spot, derivatives, and ETFs
This suggests that if Ethereum does break out, the move could still be powerful, but driven by broader capital flows rather than purely retail speculation.
Bottom Line
The chart argues that Ethereum is once again at a long-term decision point against Bitcoin. History shows that similar structures preceded major upside moves, and Merlijn believes the market may be underestimating how quickly Ethereum could move once the breakout confirms.
For now, the ETH/BTC ratio remains in re-accumulation, but if history rhymes, the next phase could redefine Ethereum’s position in this cycle.
The post Ethereum Could Be Near a Major Breakout Against Bitcoin: Here is Why appeared first on ETHNews.
