
A recent Fidelity Digital Assets report argues that Bitcoin’s four-year boom-bust pattern is structurally breaking down, and analyst Crypto Tice says the MVRV data makes it the most bullish institutional report ever published on Bitcoin.
What the MVRV Chart Shows
The Glassnode chart sourced by Fidelity Digital Assets Research plots Bitcoin’s Entity-Adjusted Market Value to Realized Value ratio across four cycles. MVRV measures how much the current market price exceeds the average price at which all Bitcoin last moved on-chain. A ratio of 1.0 means the market is trading exactly at cost basis. Higher readings mean more unrealised profit sits across the network.
The 2013 cycle in blue peaked at roughly 6x. The 2021 cycle in green peaked near 6x as well, with a secondary peak around 3x. The 2017 cycle in purple reached approximately 4.7x at its peak. The current 2025 cycle in orange has been running consistently between 2x and 2.8x throughout, never approaching the extremes of prior cycles.
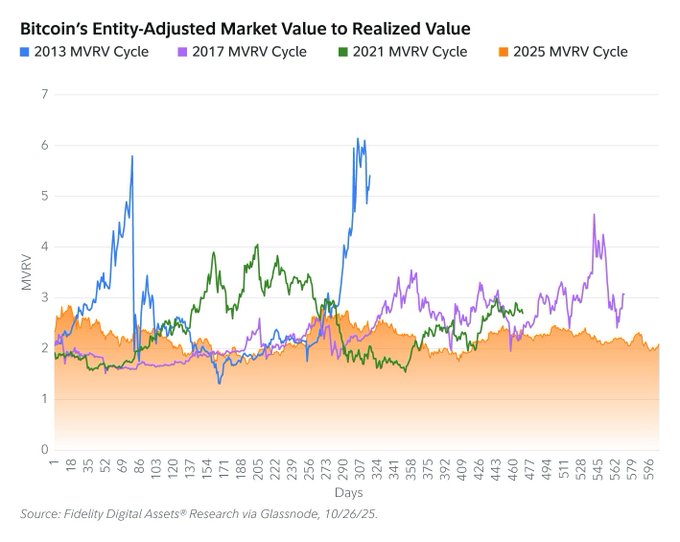
That compression is the entire argument. Prior cycles ended with MVRV readings between 4x and 6x, reflecting massive unrealised gains concentrated across the network and creating intense sell pressure as holders took profit simultaneously. The current cycle has not produced that condition.
The Institutional Infrastructure Argument
Crypto analyst Crypto Tice posted the Fidelity analysis on March 8, 2026, highlighting several data points that support the structural change thesis. Public companies and ETFs now hold 12% of all circulating Bitcoin supply. 49 companies each hold over 1,000 BTC individually. The leading Bitcoin ETF reached $75 billion in assets under management in under two years, a milestone that took the GLD gold ETF seven years to achieve, as covered in earlier reporting this week.
Bitcoin’s volatility hit 17 all-time lows in January 2026, despite the asset sitting near a $2.5 trillion market cap at its October 2025 peak. Volatility compressing at cycle highs has not occurred at this stage in any prior cycle. Institutional holders do not panic sell the way retail participants do. They rebalance. They hold through drawdowns. Their presence in the market mechanically dampens the blow-off top dynamic that defined 2013, 2017, and 2021.
What a 4x MVRV Would Mean
If the current cycle’s MVRV reaches 4x, the level that marked prior cycle peaks in 2017, Crypto Tice calculates a Bitcoin price of approximately $225,000 and a total market cap of $4.5 trillion. Current MVRV sits near 2x. The prior cycles did not end at 2x. They ended at 4x to 6x.
That gap is the bull case. Not a prediction. A structural observation about where the current cycle stands relative to historical endpoints.
What Fidelity’s Report Cannot Guarantee
The institutional infrastructure argument is coherent and data-supported. It does not eliminate downside risk. CK Zheng’s 30% decline forecast covered earlier this week is also coherent and data-supported. Both can be simultaneously true if the cycle is elongating rather than ending, with shallower pullbacks replacing the 80% crashes of prior cycles.
The MVRV chart shows this cycle is different from prior ones in magnitude. It does not show where it ends.
The post Fidelity Says the Bitcoin Boom-Bust Cycle Is Over – Here Is the Data Behind That Claim appeared first on ETHNews.
